Which US Markets Are Overbuilt?
We take a look at available inventory and rental changes in each US metro market.
Which markets are over-built versus under-built for retail in the United States?
The U.S. retail real estate market enters the second quarter of 2026 defined by a structural divergence between legacy inventory and shifting population centers. While national vacancy rates have remained remarkably resilient, holding below the 5.1% threshold for 18 consecutive quarters, a granular analysis of regional Gross Leasable Area (GLA) per capita reveals a market struggling with a profound supply-demand imbalance. The current landscape is not a monolith of strength; rather, it is a map of high-growth markets suffering from acute inventory shortages and legacy markets encumbered by an oversupply of obsolete assets.
| Market / Region | Inventory Status | Est. GLA Per Capita (Sq. Ft.) | YoY Rent Growth | Leasing Environment |
|---|---|---|---|---|
| Phoenix, AZ | Severely Underbuilt | 34.5 | +8.4% | Intense competition for pad sites; zero availability for Class A drive-thru. |
| Miami, FL | Severely Underbuilt | 36.2 | +7.9% | Record absorption rates; landlord-favorable terms with shrinking TI allowances. |
| Dallas-Fort Worth, TX | Underbuilt | 38.1 | +6.2% | Migration outpaces construction; fierce bidding for 100k+ sq. ft. backfill spaces. |
| Northern NJ / Suburbs | Constrained Supply | 42 | +5.5% | Zoning and land costs prohibit new development; record high NNN rates. |
| National Average | Baseline | 54 | +2.1% | Baseline metric for comparative analysis. |
| Cleveland, OH | Overbuilt | 61.5 | Flat | Saturated with aging secondary strip centers; rent growth stalled. |
| St. Louis, MO | Overbuilt | 62.8 | -1.10% | High vacancy in tertiary markets; capital focused on non-retail conversion. |
| Detroit, MI | Severely Overbuilt | 64 | -1.80% | Legacy enclosed mall surplus; widespread functional obsolescence. |
The Sun Belt Deficit: Underbuilt and Over-Capacity
The most significant inventory shortages are concentrated in the Sun Belt and specific Western submarkets where domestic migration has outpaced commercial construction for nearly five years. Markets such as Phoenix, Las Vegas, and Miami are currently operating at near-zero availability for high-quality Class A retail space. In Phoenix, despite a record $2.1 million AUV for drive-thru concepts, the lack of new pad sites has forced rental rates for second-generation space upward by 8.4% year-over-year.
This scarcity is quantifiable through the lens of GLA per capita. In high-growth corridors of Florida and Texas, the retail square footage per resident has fallen to approximately 35 square feet, significantly below the national average of 54 square feet. This deficit has fundamentally altered the leasing environment, creating a "landlord’s market" where tenant improvement allowances have contracted by 15% since 2024. In the Inland Empire and Dallas-Fort Worth, the lack of available inventory is now the primary constraint on national expansion plans for mid-box retailers and value grocers, who find themselves in bidding wars for backfill spaces exceeding 100,000 square feet.
The Rust Belt and Northeast: Managing the Legacy Surplus
Conversely, several legacy markets in the Midwest and Northeast remain technically overbuilt, characterized by a surplus of retail square footage that no longer aligns with current consumer density or behavior. Cities such as Detroit, Cleveland, and St. Louis possess some of the highest GLA-per-capita ratios in the country, often exceeding 60 square feet per person. In these regions, the oversupply is not a result of recent over-development, but a failure to rationalize or demolish aging enclosed malls and secondary strip centers built during the 1980s and 1990s.
While the "Flight to Quality" has stabilized rents for primary anchors in these regions, the secondary and tertiary submarkets continue to exhibit stagnating rental growth and elevated vacancy. In specific Ohio and Pennsylvania corridors, the surplus of retail inventory has prevented the cap rate stability seen in the Sun Belt. Consequently, investors in these overbuilt regions are increasingly focused on redevelopment and asset conversion—repurposing retail sites for medical office or last-mile industrial use—as the only viable path to clearing excess GLA.
The Construction Lag and the Suburban Pivot
The regional imbalance is being exacerbated by a historic pullback in new retail construction. Nationally, the retail pipeline has contracted by nearly 25% year-over-year as elevated interest rates and labor costs have moved the "break-even" point for ground-up development to unsustainable levels. This supply-side pressure is most acute in high-income suburban "doughnut" rings—areas surrounding major urban cores where population density has increased, but zoning and construction costs have prohibited new retail infrastructure.
In these suburban submarkets, rental prices for prime storefronts have reached record highs, often surpassing $45 per square foot NNN in affluent pockets of New Jersey and Northern Virginia. This pricing is a direct reflection of a structural underbuilt condition. Retailers are no longer choosing sites based on proximity to other brands, but rather on the sheer availability of space. As we move through 2026, the delta between "haves" and "have-nots" in the retail sector will likely be determined by geographic placement; the brands that secured space in the underbuilt Sun Belt will benefit from sustained traffic, while those tied to overbuilt legacy assets will continue to face the pressures of a diluted consumer base.

Follow Us
Recent Blog Posts
Read the Blog
What Makes a Good Shopping Center? How The Grove’s Tenant Mix Drives Cross-Shopping
10 min read

World Cup Economic Impact on Retail: Which Businesses Benefited Most Near U.S. Stadiums?
10 min read

Top 5 Best Location Intelligence Platforms for Retail Real Estate in 2026
5 min read
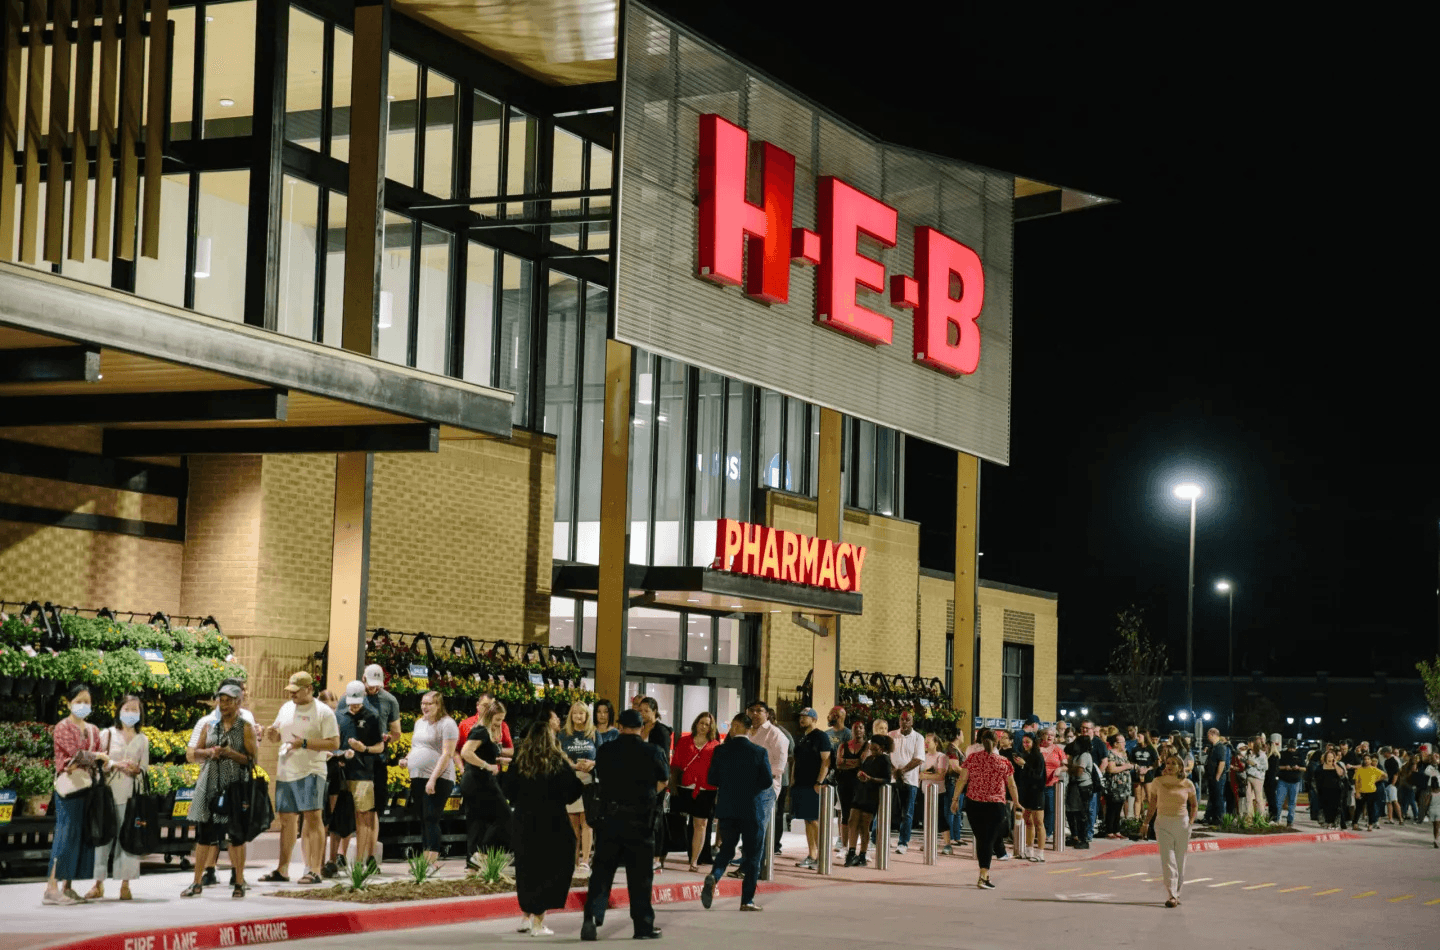
Where H-E-B Is Growing Fastest
5 min read