Ross Dress For Less
Crossings At Corona / 2519 Tuscany St, Corona, CA, US
34 Sq.
We source our data from top credit & debit card issuers. We procure transaction swipes that take place at stores all throughout the country, and pair those transactions to individual locations. This gives you a view of credit & debit card activity at single-tenant locations, multi-tenant locations, chains, and more.


Basically: We’ll tell you if this is a good store, or a bad store.
Ross Dress For Less
Crossings At Corona / 2519 Tuscany St, Corona, CA, US
34 Sq.


CenterCheck measures shopper demographics associated with their transacting card. We can tell you precisely the attributes of your shoppers, how often they return, for how much, where else they shop, and how consumer appetites change over time at a hyper-localized level.
| Category | Attribute | Description | Example Payload |
|---|---|---|---|
| POI | id (STRING) | - | 001dd142-4627-4bcf-be8a-b048eb11ed29 |
| POI | parent_poi_id (STRING, NULLABLE) | Unique ID of the parent POI, if any | 00cb3342-974b-4e40-8976-ccdfdc0a5ce9 |
| POI | brand_id (STRING, NULLABLE) | Unique id of the brand, if any | 00aa90d9-efa3-4cda-aa32-fb37e4e915d8 |
| POI | name (STRING) | Name of the POI | Five Below |
| POI | street_address (STRING) | Address of the POI | 169 Danbury Rd |
| POI | postal_code (STRING) | Postal code of the POI | 6776 |
| POI | city (STRING) | City of the POI | New Milford |
| POI | state (STRING) | State code of the POI | CT |
| POI | latitude (FLOAT) | Latitude | 41.549152 |
| POI | longitude (FLOAT) | Longitude | -73.416756 |
| POI | naics_code (INTEGER) | NAICS Code | 452319 |
| POI | area_sq_foot (FLOAT) | Area in sq. foot | 4047.2264 |
| POI | category (STRING) | Category of the POI | General Merchandise Stores, including Warehouse Clubs and Supercenters |
| POI | estimated_closed_date (DATETIME, NULLABLE) | Estimated closed date (based on transaction stability) | 2024-01-01 5:00:00 |
| POI | accessibility (STRING ARRAY, NULLABLE) | Accessibility features the POI may have | [Parking, Wheelchair Accessible, Wheelchair Accessible Restroom] |
| POI | activities (STRING ARRAY, NULLABLE) | Potential activities the POI may have | [Dancing, Pool and Billiards] [Karaoke] [Climbing] [Dancing, Trivia] |
| POI | amenities (STRING ARRAY, NULLABLE) | Potential amenities this POI may have | [Bar On-site, Outdoor Seating, Public Restrooms, Restrooms, TV] [Wifi, Fitness Center] |
| POI | has_parking (BOOLEAN) | If the POI has parking or not | TRUE/FALSE |
| POI | has_drive_thru (BOOLEAN) | If the POI has drive thru or not | TRUE/FALSE |
| Brands | id (STRING) | Unique ID of the brand | 00aa90d9-efa3-4cda-aa32-fb37e4e915d8 |
| Brands | name (STRING) | Name of the brand | Five Below |
| Financials | poi_id (STRING) | Unique ID of the POI | 001dd142-4627-4bcf-be8a-b048eb11ed29 |
| Financials | revenue_amount (FLOAT) | Revenue amount generated at the POI over the period | 2309.88 |
| Financials | transactions_amount (FLOAT) | Amount of cards that transacted at the POI over the period | 657 |
| Financials | customers_amount (FLOAT) | Amount of unique customers that transacted at the POI over the period | 599 |
| Financials | start_at (DATE) | Start date of the period | 2024-01-01 |
| Financials | end_at (DATE) | End date of the period | 2024-01-31 |
| Cardholder Metrics | Zip Code | Capture Area: The zip codes in which the card was issued who shop at the store | [14503, 20252] |
| Cardholder Metrics | Gender | The gender makeup of shoppers | [Male, Female] |
| Cardholder Metrics | Age | Average age of the cardholders shopping | 23 |
| Cardholder Metrics | Income bracket | Average annual income of shopper | 52000 |
| Cardholder Metrics | Business Owner | Average amount of shoppers who own businesses | Yes / No |
| Cardholder Metrics | Has Children | Indication of if shoppers are parents | Yes / No |
| Cardholder Metrics | Homeowner or Renter | Indication of if shoppers own or rent a home | Yes / No |
| Cardholder Metrics | Ethnicity | Ethnic makeup of shoppers | Caucasian |
| Advanced Research | Competitive / Complimentary Rate | How optimized is its placement respective to its neighbors | 0.22 |


See where your customers are coming from, where they shop first, where else they have shopped, and how that changes based on specific demographic attributes of your patrons.
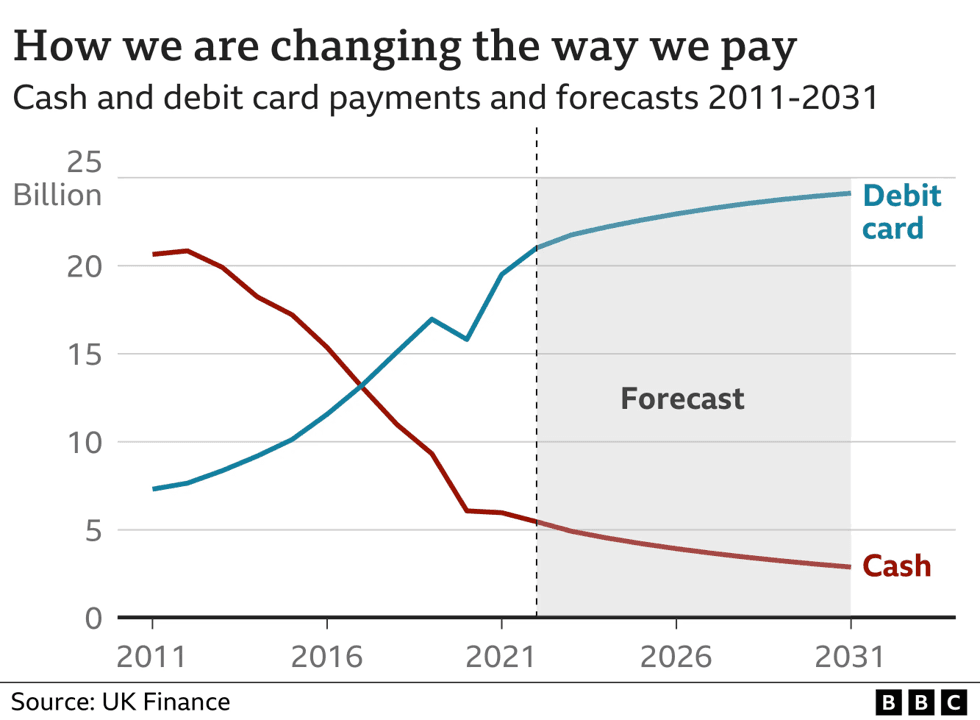
Book a DemoIn 2024, 90.3% of Americans have adopted debit cards as a method of payment, whereas 82.3% have adopted credit cards.


If your goal is to estimate the total sales performance including cash, we recommend adjusting for a buffer to include cash based on your understanding of the retailer, location, and more.
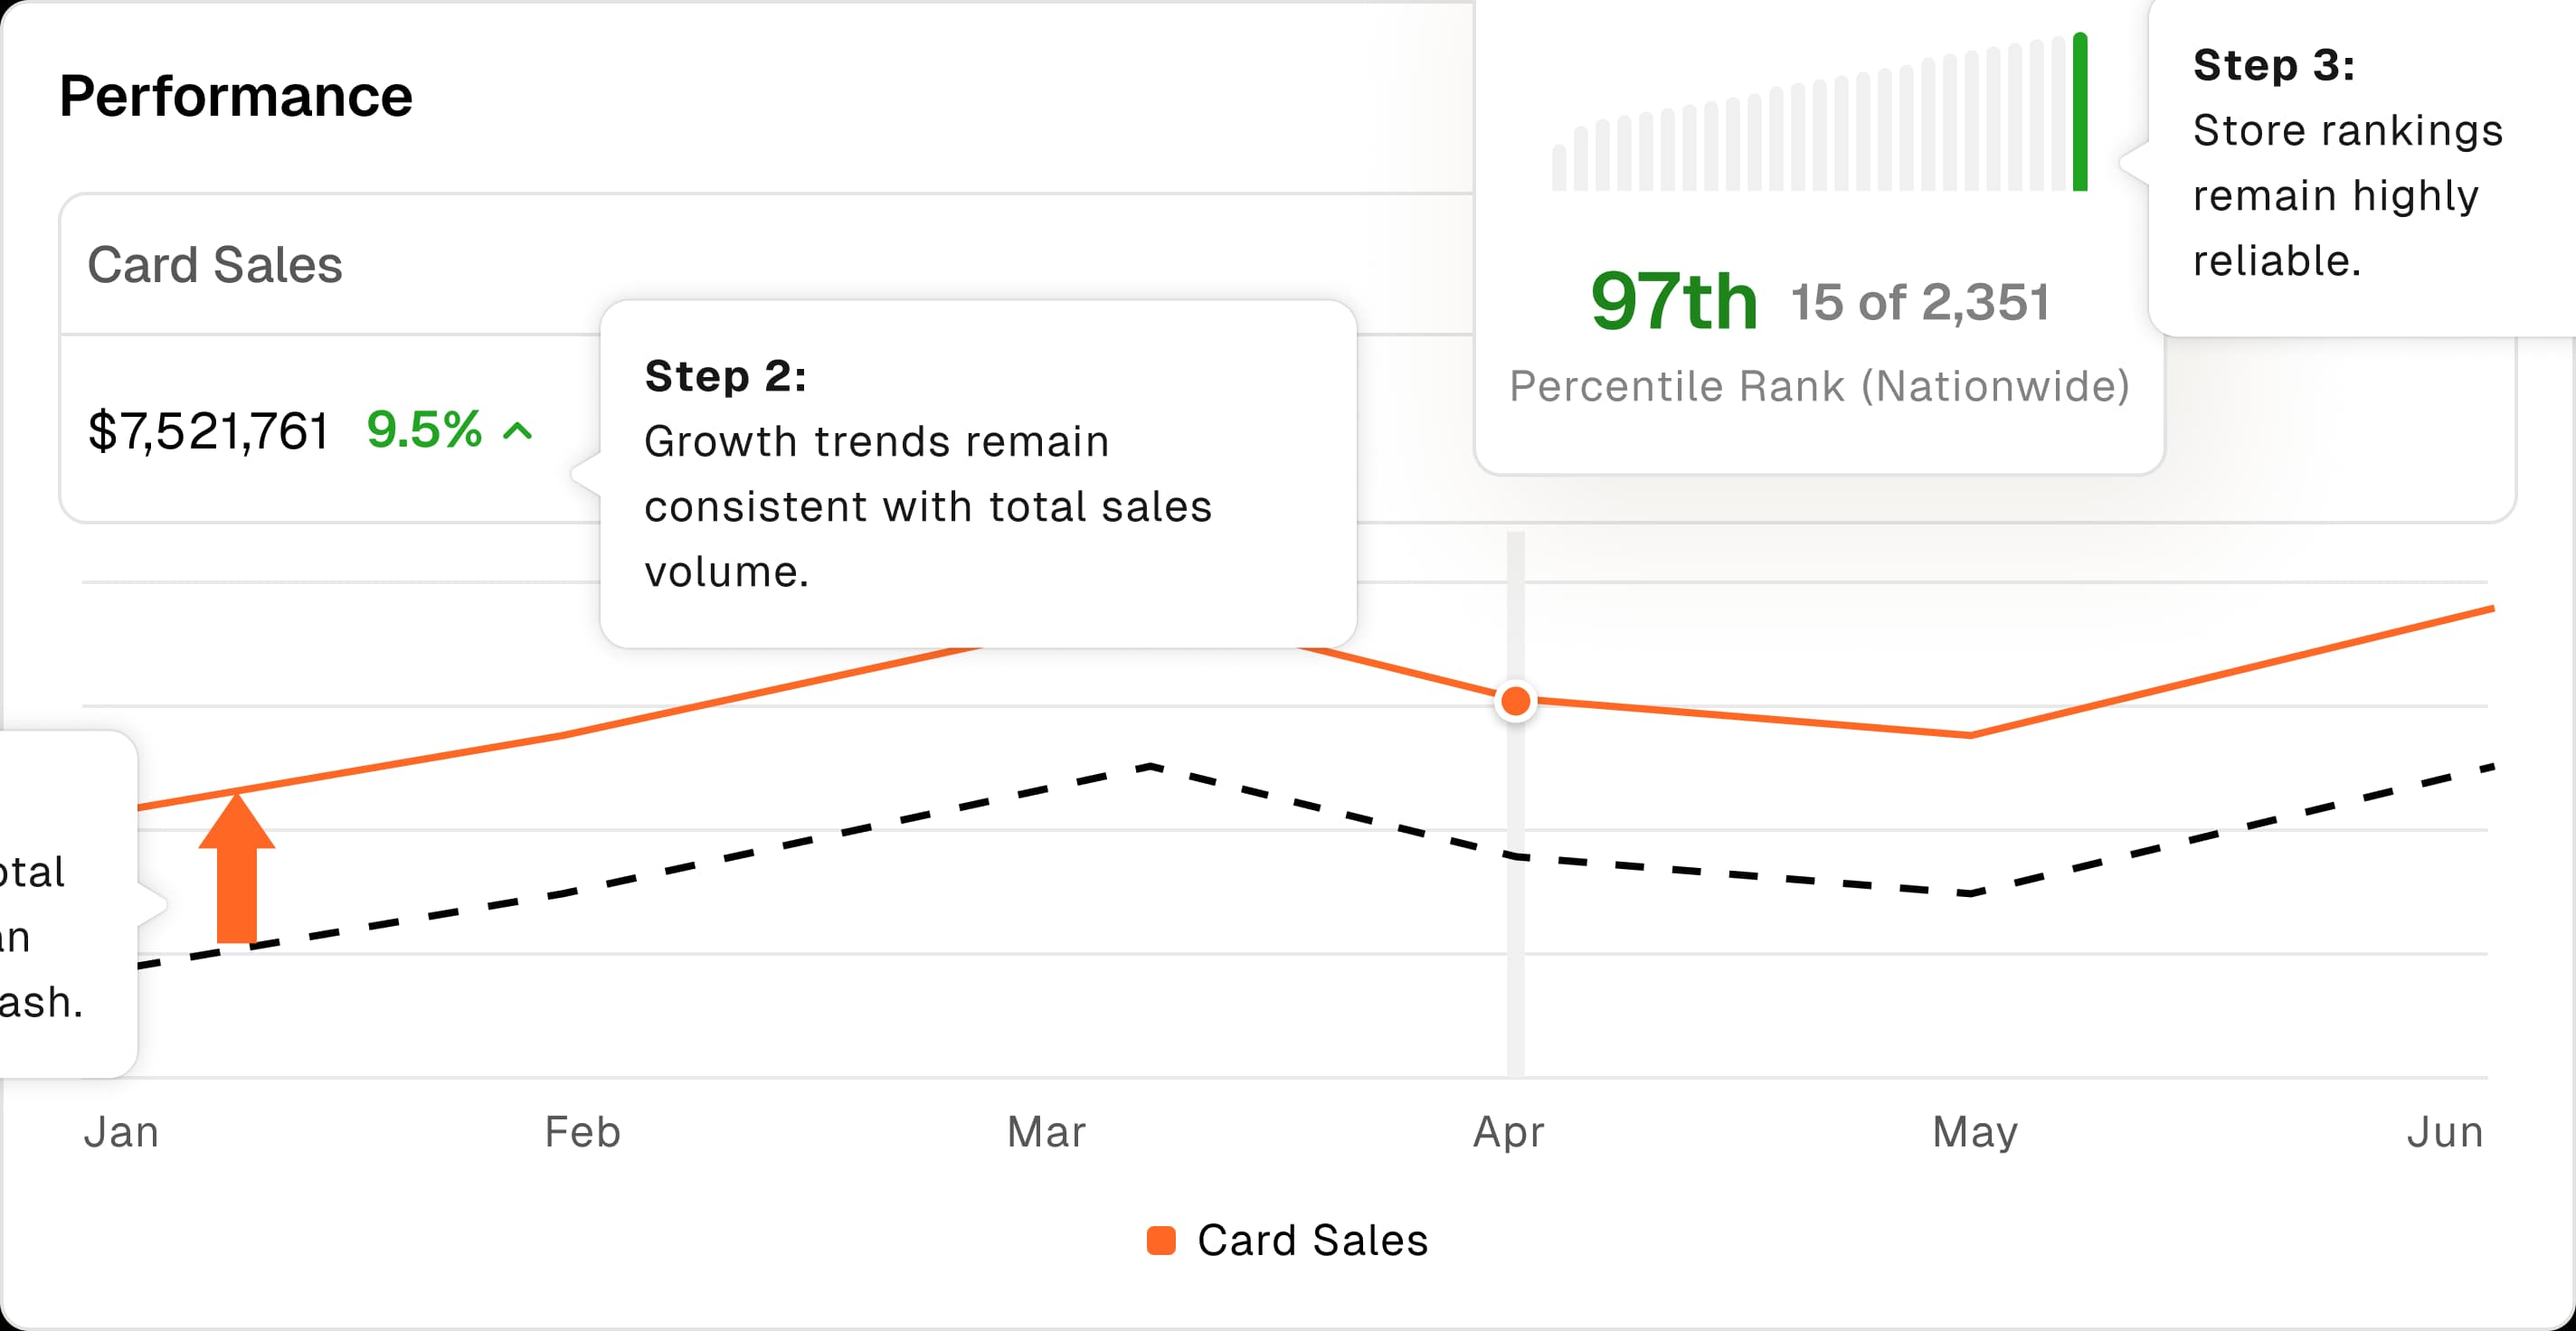
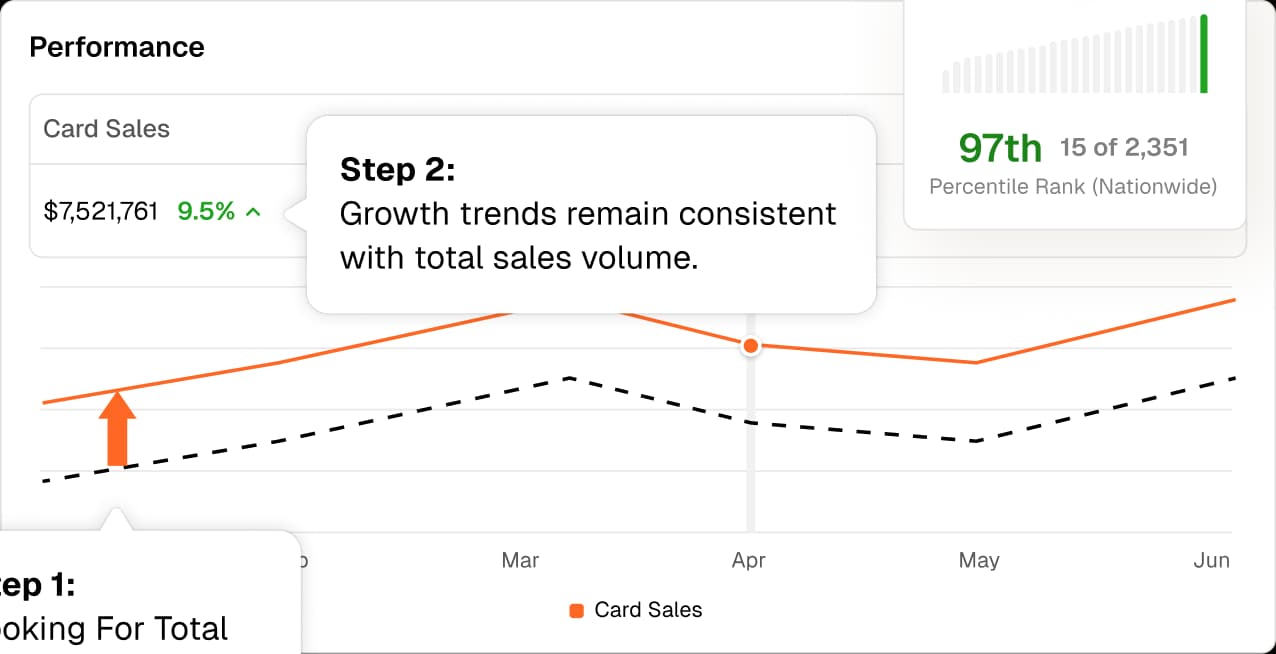
Step 1:
Looking For Total Sales? Make an estimate for cash.
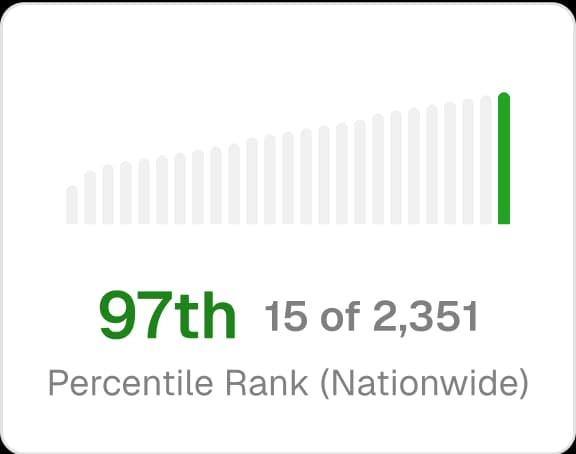
Step 3:
Store rankings remain highly reliable.
One of the biggest variables in card usage is a person’s income level. Below is a demonstration of card coverage by household annual income.

If an EBT card is issued by Visa, Mastercard, or another supported card type, we will capture it.


Yes! If the card associated with the Apple Pay or Google Pay account is one of our supported cards, we capture it.


Yes! If the store-branded card is issued by VIsa, Mastercard, or another supported card type, we will capture it.


Locations where the majority of purchases take place on site, at a point of sale.
Ex: Grocery stores, quick service restaurants, dining, entertainment, big box stores, fashion brands, retailers, and more.
Businesses in which a large portion of revenue takes place at a point of sale system away from individual locations, or where subscription revenue makes up a large portion of the total sales volume.
Ex: Cellular stores, non-franchised gyms, pre-loaded mobile app payments like Starbucks.