World Cup Economic Impact on Retail: Which Businesses Benefited Most Near U.S. Stadiums?
CenterCheck data shows that the World Cup generated its strongest retail gains on match days, with sporting goods, hotels, transportation, restaurants, and fast casual restaurants capturing the greatest increases in consumer spending.
Major sporting events are often promoted as economic catalysts for their host cities. Thousands of visitors arrive, hotels fill, restaurants become gathering places, and surrounding businesses prepare for an influx of customers.
The more difficult question is whether that activity produces measurable gains for nearby merchants—and which types of businesses actually benefit.
CenterCheck analyzed card spending near the 11 U.S. World Cup host stadiums to measure the tournament’s retail impact. The findings reveal a clear event effect, but one that was concentrated in specific categories and became significantly stronger on the days matches were played.
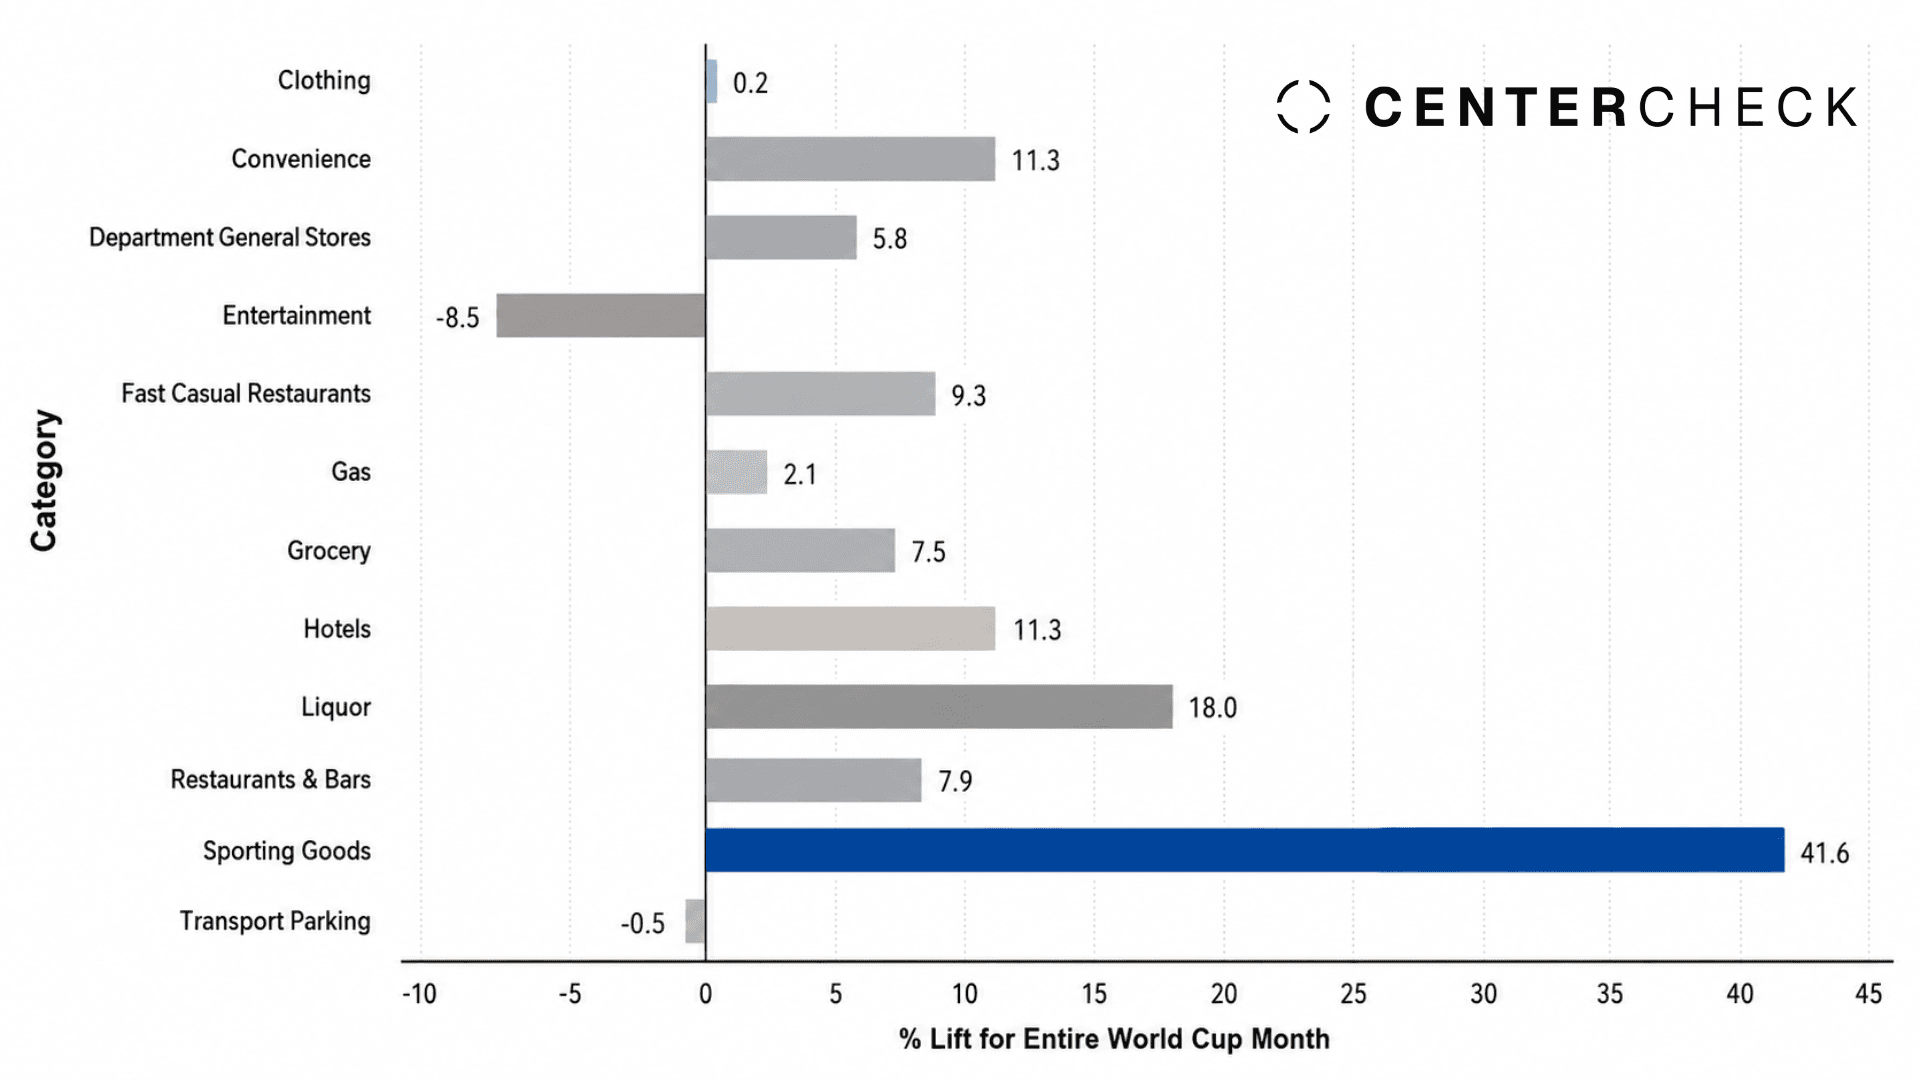
Across the full tournament period, sporting goods stores recorded the strongest increase, rising 41.6% relative to the control group. Liquor stores increased 18%, while convenience stores and hotels each rose 11.3%.
On match days, however, the economic impact became considerably more pronounced. Sporting goods spending increased 66.7%, hotel spending rose 43.7%, and transportation and parking increased 19.1%.
The results suggest that large sporting events do not create a uniform increase in retail activity. Instead, they temporarily redirect consumer spending toward the businesses most closely connected to attendance, travel, preparation, convenience, and the fan experience.
Measuring the World Cup’s Retail Impact
CenterCheck measured card spending at merchants located within three miles of each U.S. host stadium.
For every merchant, spending during the tournament was compared with that merchant’s own May 2026 pre-tournament baseline. The analysis then adjusted performance against a control group composed of categories that were less likely to be influenced by soccer matches, including home improvement, hardware, building materials, paint, glass, and automotive parts.
This means the percentages represent estimated spending lift relative to the broader control trend—not simply the raw change in card transactions from May.
The analysis examined two primary periods:
- Full tournament window: June 11 through July 13, 2026
- Match-day window: Only the days on which each stadium hosted a World Cup match
A third, expanded window covering the day before, the match day, and the day after was also evaluated to capture spending that may occur outside the event itself, particularly for hotels, restaurants, liquor stores, and other travel-related categories.
Cardholders were also divided into two groups:
- Local consumers: Cardholders who lived within 60 miles of the stadium
- Visitors: Cardholders who lived more than 60 miles from the stadium
Sporting Goods Stores Were the Tournament’s Biggest Retail Winners
Sporting goods generated the largest increase across both measurement periods.
During the full tournament window, spending at sporting goods stores increased 41.6%. On match days, that figure accelerated to 66.7%.
The category includes national retailers such as Dick’s Sporting Goods, Academy Sports + Outdoors, Hibbett Sports, REI, Big 5 Sporting Goods, and stores specializing in team apparel and fan merchandise.
The size of the increase suggests that consumer spending was not limited to purchases made inside stadiums. Fans also spent at nearby retailers before attending matches, purchasing jerseys, apparel, sporting equipment, accessories, and other event-related merchandise.
For retailers and landlords, the result illustrates how a major event can extend demand beyond the venue itself. Sporting goods stores located near host stadiums became part of the broader fan experience, capturing spending from both prepared attendees and last-minute shoppers.
Hotels Experienced the Strongest Travel-Related Impact
Hotels recorded an 11.3% increase during the full tournament period and a 43.7% increase on match days.
The category includes Marriott, Hilton, Hyatt, Holiday Inn, Best Western, Motel 6, independent hotels, boutique properties, and other lodging expenses billed directly to the property.
The difference between the full-window and match-day results demonstrates how concentrated hotel demand became around individual fixtures. While travelers may have arrived before a match and departed afterward, hotel spending was still closely connected to the days stadiums hosted games.
The broader three-day window is particularly important for interpreting hotel activity. Unlike transportation or fast casual restaurants, lodging is frequently reserved or billed before the event itself. Measuring only the day of the match may therefore understate the complete hospitality effect.
For hotel operators, owners, and nearby retail landlords, event calendars may provide a more useful picture of short-term demand than monthly averages alone. A limited number of high-attendance dates can materially alter performance even when the surrounding month appears comparatively normal.
Restaurants, Bars, and Fast Casual Restaurants Captured the Fan Experience
Food and beverage categories recorded meaningful increases throughout the tournament.
Fast casual restaurant spending increased 9.3% across the full window and 18.3% on match days. Restaurants and bars increased 7.9% during the tournament and 13.9% on match days.
The fast casual restaurant category includes quick-service and counter-service businesses such as McDonald’s, Chipotle, Chick-fil-A, Taco Bell, Shake Shack, Starbucks, and similar concepts. Restaurants and bars include sit-down restaurants, pubs, breweries, taverns, sports bars, cocktail bars, and catering businesses.
The increase reflects two different types of demand.
Fast casual restaurants benefited from convenience. Fans traveling to and from matches needed meals that were fast, familiar, and easily accessible.
Restaurants and bars benefited from the social nature of the event. Matches created demand before kickoff, during broadcasts, and after the final whistle as fans gathered to eat, drink, and watch games together.
These results are especially relevant to retail property owners evaluating tenant mix around stadiums, arenas, convention districts, and entertainment destinations. Businesses that support both convenience and social gathering appear particularly well positioned to capture event-driven demand.
Transportation and Parking Surged on Match Days
Transportation and parking declined slightly, by 0.5%, across the full tournament window. On match days, however, the category increased 19.1%.
The category includes Uber, Lyft, taxis, public transit, rail, parking lots, and parking garages.
This contrast is one of the clearest examples of why monthly or tournament-wide averages can obscure the true economic impact of an event.
Transportation demand was not consistently elevated throughout the entire tournament. It rose sharply when matches actually occurred.
For cities and property owners, this distinction matters. A major sporting event may generate enormous short-term pressure on transportation networks and parking capacity without producing the same level of activity on surrounding non-match days.
The findings also reinforce the value of evaluating economic performance at the daily level. The event effect is often highly concentrated rather than evenly distributed.
Grocery and Convenience Stores Benefited From Preparation Spending
Grocery spending increased 7.5% during the full tournament and 11.3% on match days. Convenience-store spending rose 11.3% during the tournament and 10.5% on match days.
The grocery category includes Kroger, Safeway, Whole Foods Market, Trader Joe’s, local butchers, bakeries, and other food retailers. Convenience includes 7-Eleven, Circle K, corner markets, mini-marts, and similar stores.
These increases suggest that World Cup-related spending extended beyond restaurants and stadium concessions.
Fans purchased food, beverages, snacks, and supplies for watch parties, tailgating, hotel stays, and travel. Nearby residents may also have shifted their shopping behavior in preparation for increased traffic or social gatherings.
Liquor spending provides an especially interesting contrast. It increased 18% across the full tournament window but declined 6.2% on match days.
One possible explanation is that alcohol purchases frequently occurred before match day rather than on the day of the event. Consumers may have stocked up in advance for watch parties or purchased beverages during the days surrounding a match.
This interpretation is consistent with the expanded three-day analysis, in which liquor spending returned to positive territory. The finding demonstrates why the timing of a purchase does not always correspond exactly with the timing of consumption.
Department and General Merchandise Stores Recorded Moderate Gains
Department and general merchandise stores increased 5.8% during the tournament and 12.1% on match days.
The category includes Macy’s, Nordstrom, Target, Walmart, Kohl’s, dollar stores, and other general variety retailers.
These businesses may have benefited from a wide range of event-related needs, including apparel, travel products, food, personal care items, souvenirs, and last-minute purchases.
The match-day increase indicates that general merchandise retailers can capture event-driven spending even when they are not directly associated with sports or hospitality. Their broad product selection allows them to serve multiple customer needs simultaneously.
For retail owners, this may increase the value of having flexible, high-utility retailers located near major event destinations.
Not Every Retail Category Benefited
The World Cup created winners, but it also redirected spending away from certain activities.
Entertainment spending declined 8.5% across the full tournament and 6.5% on match days. The category includes amusement parks, movie theaters, bowling alleys, trampoline parks, ticket agencies, golf courses, arcades, zoos, and aquariums.
The decline suggests that the tournament may have competed with other forms of entertainment for consumers’ time and discretionary spending.
When a major match becomes the primary entertainment occasion, consumers may postpone a movie, amusement-park visit, bowling trip, or other recreational activity.
Clothing spending was largely unchanged across the tournament, increasing only 0.2%, and declined 1.6% on match days. The category includes apparel retailers such as H&M, Old Navy, Gap, Zara, Nike, adidas, Vans, Foot Locker, and family clothing stores.
The contrast between clothing and sporting goods is notable. Consumers did not broadly increase apparel purchases. Spending was concentrated in sports-related merchandise and fan gear.
That distinction shows why broad retail categories can conceal important differences in consumer intent. Demand did not rise simply because a store sold clothing. It rose when the merchandise was connected to the event.
Tournament-Wide Retail Impact
| Category | Spending Lift |
|---|---|
| Sporting Goods | 41.6% |
| Liquor Stores | 18.0% |
| Convenience Stores | 11.3% |
| Hotels | 11.3% |
| Fast Casual Restaurants | 9.3% |
| Restaurants and Bars | 7.9% |
| Grocery Stores | 7.5% |
| Department and general stores | 5.8% |
| Gas Stations | 2.1% |
| Clothing Stores | 0.2% |
| Transportation and Parking | -0.5% |
| Entertainment | -8.5% |
Match-Day Retail Impact
| Category | Spending Lift |
|---|---|
| Sporting Goods | 66.7% |
| Hotels | 43.7% |
| Transportation and Parking | 19.1% |
| Fast Casual Restaurants | 18.3% |
| Restaurants and Bars | 13.9% |
| Department and General Stores | 12.1% |
| Grocery Stores | 11.3% |
| Gas Stations | 10.7% |
| Convenience Stores | 10.5% |
| Clothing Stores | -1.6% |
| Liquor Stores | -6.2% |
| Entertainment | -6.5% |
The World Cup Created a Concentrated Retail Economy
The data indicates that the World Cup generated a meaningful retail effect near U.S. host stadiums, but the benefit was neither uniform nor evenly distributed.
The strongest gains occurred in categories directly connected to the fan journey.
Sporting goods captured enthusiasm and merchandise demand.
Hotels captured visitor stays.
Transportation and parking supported movement to and from stadiums.
Restaurants, bars, and fast casual restaurants captured social and convenience spending.
Grocery, convenience, and general merchandise stores benefited from preparation and last-minute purchases.
The match-day results were consistently stronger than the full-window findings. Sporting goods rose from 41.6% during the broader tournament period to 66.7% on match days. Hotels increased from 11.3% to 43.7%. Transportation and parking moved from a slight decline to a 19.1% increase.
For retailers, landlords, investors, and host cities, the lesson is that event-driven economic impact should not be measured only through monthly averages, attendance figures, or broad tourism estimates.
The economic value of a major event can appear in a small number of highly concentrated days, within a limited geographic radius, and across a specific group of merchants.
Understanding those patterns can help retailers plan staffing and inventory, help landlords identify tenants positioned to capture event demand, and help cities evaluate which businesses truly benefit when a global sporting event comes to town.
The World Cup did more than bring fans into stadiums. It temporarily reorganized the retail economy surrounding them—and transaction data shows where the spending went.

Follow Us
Recent Blog Posts
Read the Blog
CenterCheck 2026 Review: Details & Features
25 min read
A&E’s $600M Loan Default Highlights Rent-Regulated CMBS Struggles
10 min read
Spirit Halloween Is Acquiring Hot Topic. Here’s What Retail Owners Should Watch For
10 min read
How Comic-Con 2026 Impacted Retail Sales in San Diego: 10 Findings for Retail Real Estate
10 min read