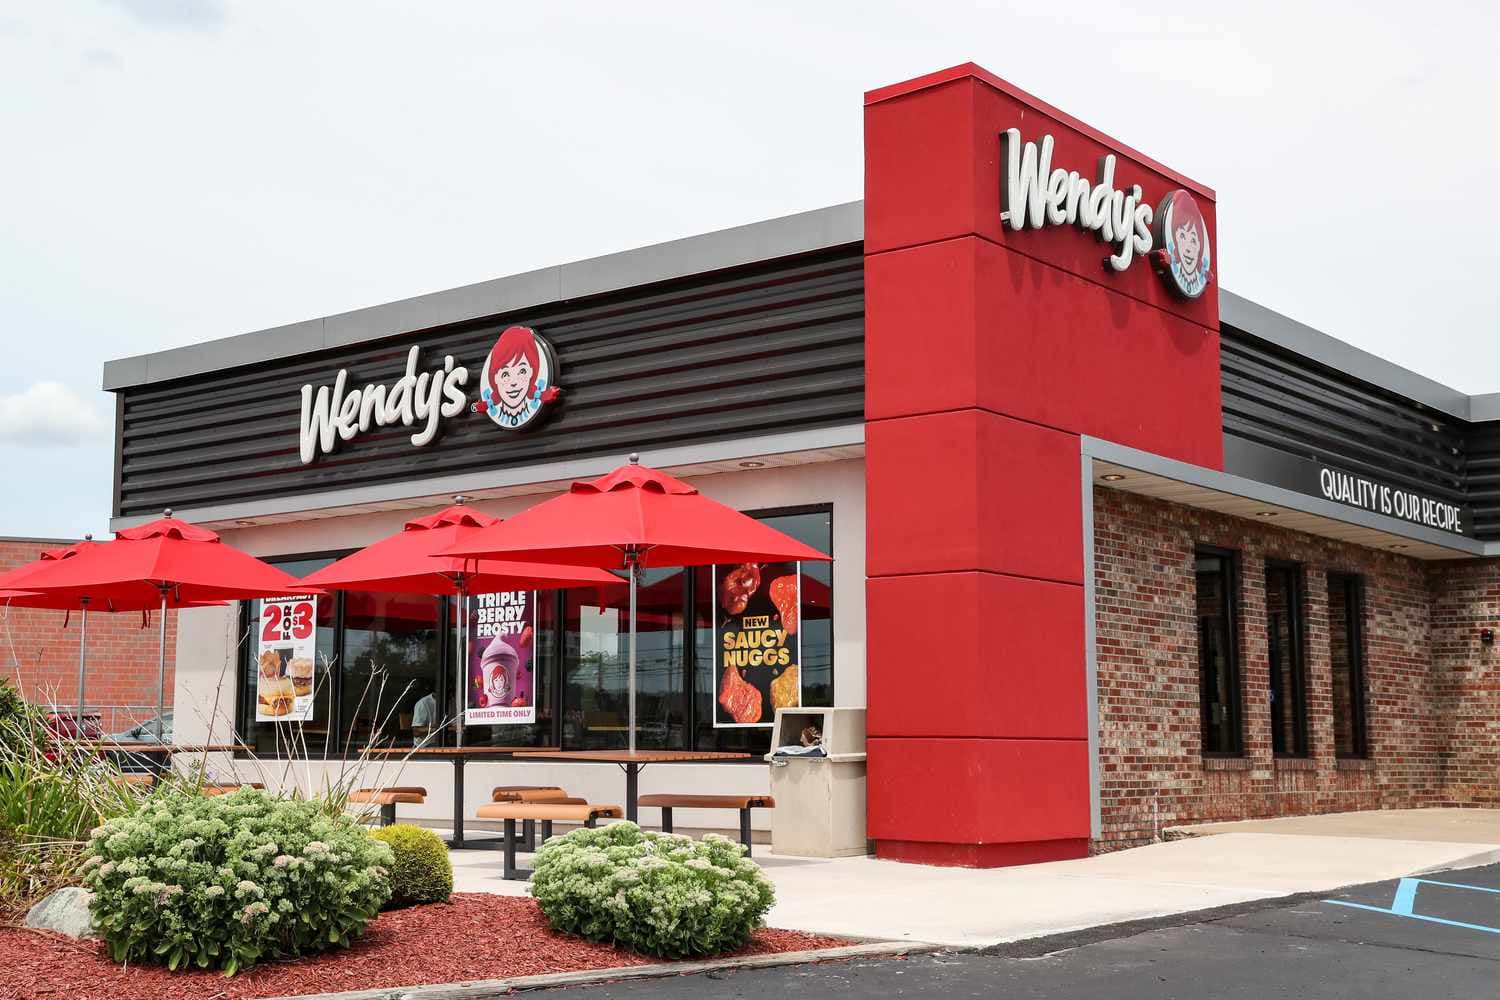
Wendy’s July Sales Ease as Value Math Gets Tested
CenterCheck’s first-party data shows Wendy’s generated $955.2 million in U.S. sales across a fixed base of 5,000 restaurants in July 2025, down from $971.9 million at the same stores a year earlier. That represents a $16.7 million shortfall and a 1.72% year-over-year decline on a like-for-like basis. On a per-unit view, the average restaurant produced $191,040 in July versus $194,380 last year—a decrease of $3,340 per store, or about $108 per day.
The decline aligns with recent signals from the company itself. In second-quarter remarks, Wendy’s executives noted that U.S. same-restaurant sales were down 3.6%, citing weaker traffic even as average check sizes remained elevated. Leadership acknowledged “work to do to improve the overall performance of the business,” and trimmed full-year guidance, pointing to pressure from cautious consumer spending.
Industry analysts have underscored the trend more broadly: quick-service traffic has begun to soften as diners push back against sustained menu price inflation. Consumers are recalibrating their budgets, which makes clarity of value proposition central. In this environment, price-led growth can no longer mask volume losses—transaction counts matter again.
The competitive contrast is instructive. McDonald’s reported positive U.S. comps over the same period, attributing the lift to a sharper value platform and stronger digital engagement. Where Wendy’s saw softness in visit frequency, rivals with more defined price ladders or bundled offers managed to sustain guest counts.
For commercial real estate stakeholders, even a modest step-down in per-unit sales changes the math. Wendy’s is a reliable tenant class, often anchoring pad sites and neighborhood centers. But a 1.72% pullback equates to $3,340 less per box in just one month—a figure that compounds quickly across quarters, especially with occupancy costs elevated by taxes and CAM charges. Landlords tracking sales-per-square-foot performance will see thinner margins above percentage rent thresholds, which can influence lease renewals and new development underwriting.
The operational levers ahead are clear. To reaccelerate traffic, Wendy’s will need to sharpen promotional clarity—ensuring offers are simple, compelling, and well-timed. Daypart expansion at breakfast and late night remains an avenue for incremental visits without resetting menu pricing. For investors, the key metrics to watch are whether per-unit volumes stabilize near the $191,000 per month level or drift lower toward a $2.27 million annual run rate. The difference, only a handful of checks per day per store, scales quickly across 5,000 units and can decisively shape both corporate strategy and real estate decisions.
Methodology: CenterCheck measures U.S. store-level sales from anonymized transaction data and merchant panels. Figures reflect the same 5,000 Wendy’s restaurants on a like-for-like basis and are not seasonally adjusted. July has 31 days in both periods.