A New CenterCheck Mapping Experience
Finding economic performance of retail stores, trade areas, and chains has never been easier!
A Guided Walkthrough of CenterCheck’s New Mapping Experience
CenterCheck’s latest mapping experience is designed to make retail sales analysis faster, more visual, and more actionable—without ever leaving the map.
View The Map In Action
Understanding the Data
CenterCheck tracks retail performance nationwide using aggregated credit and debit card transactions. This allows users to analyze store-level sales, customer behavior, and broader economic activity across cities, trade areas, and custom geographies.
Navigating the Map
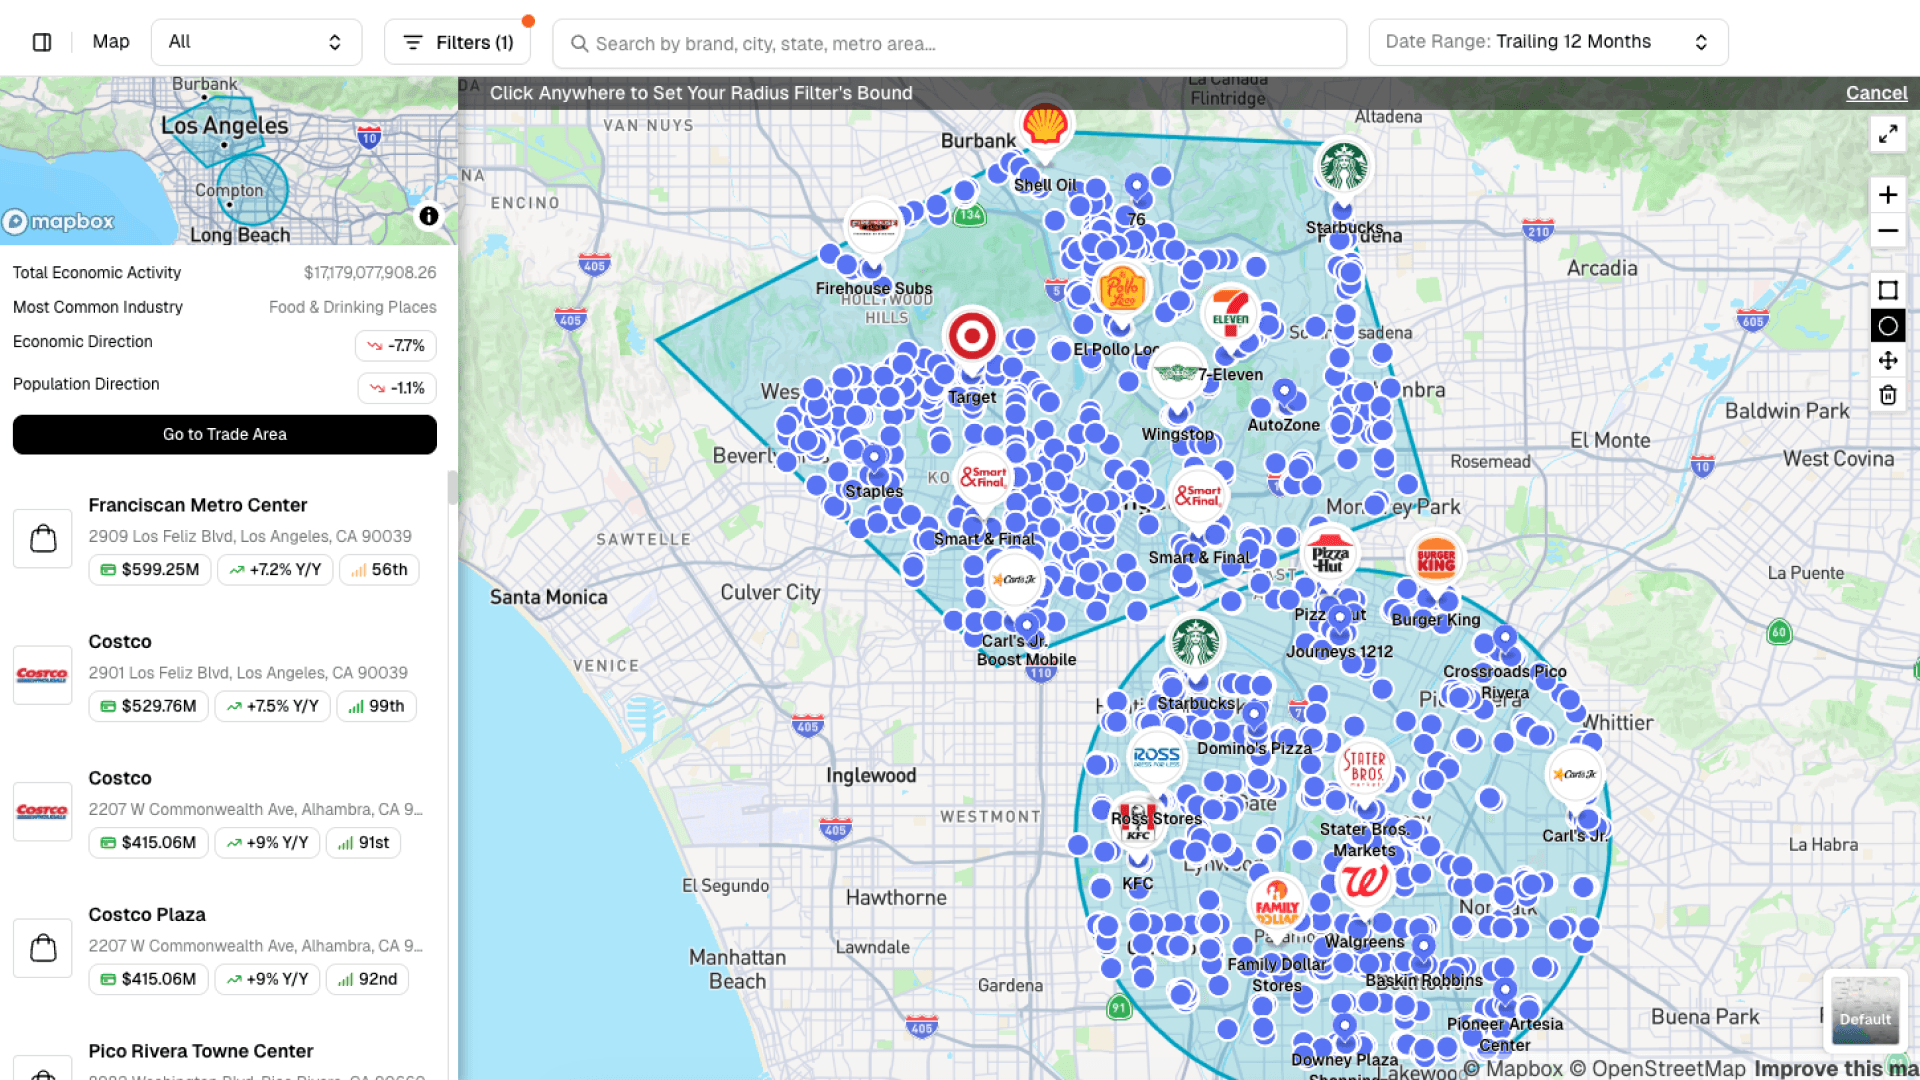
The map is fully interactive. Users can drag to any location, where each purple dot represents a tracked retail store. Clicking a location opens a new mini card, allowing quick navigation between sites while staying in the map view.
At a glance, the mini card shows:
- Total sales at the location
- Rank within the brand’s national portfolio
- Visit timing by day and hour
- Customer attributes, including age, gender, income level, and parental status
These customer insights are derived directly from transaction behavior and are unique to CenterCheck.
Searching by Geography
Search has been significantly expanded. Users can now:
- Pull up entire cities (e.g., Los Angeles)
- Instantly generate predefined polygons
- View total economic activity within the selected area
- See dominant industries and directional trends in population and spending
This makes it easy to understand how economic activity is distributed across any market.
Filtering for Opportunity
Advanced filters allow users to narrow results with precision. For example, users can:
- Select an industry (such as fast food)
- Filter for low-performing locations
- Identify stores with declining sales trends over time
Results instantly update on the map, returning only locations that meet the selected criteria.
Creating Custom Trade Areas
Users can layer multiple custom polygons—circles or free-draw shapes—to expand or refine their search area. This is especially useful when analyzing multiple submarkets or areas near existing offices or assets.
Generating Reports
With one click, users can convert any mapped search into a trade area report, summarizing:
- Total economic activity
- Transaction counts
- Population data
- Industry mix
- Census attributes and transacting customer characteristics
These reports can be downloaded for site visits, broker meetings, or underwriting—or saved as named opportunities for ongoing deal tracking.
From Map to Action
Whether identifying underperforming fast-food locations for re-tenanting or analyzing city-wide retail trends, the new mapping experience turns raw transaction data into clear, actionable insight—directly from the map.
This is CenterCheck’s new mapping experience, now live.

Follow Us