CBRE US Net-Lease Investment Q4 2025 Finishes Up 16%
Net-lease investment volume increased by 38% % quarter-over-quarter and 13% year -over-year in Q4 to $16 billion.
Net-lease investment volume increased by 38% % quarter-over-quarter and 13% year -over-year in Q4 to $16 billion. Annual net-lease investment volume increased by 16% to $51.4 billion in 2025. This increase trailed the 22% rise in total commercial real estate volume. Net-lease office investment rose by 49% year-over-year to $3.8 billion in Q4, retail investment increased by 15% to $3.3 billion and industrial investment rose by 1% to $8.8 billion.
The caveat? It actually trailed the broader commercial real estate market, which saw a 22% rise. This lag indicates that while liquidity is returning, the net-lease sector—often a proxy for bond-like safety—is being traded with increasing selectivity.
The most compelling signal in the data is not the total volume, but the allocation of that capital. The market witnessed a significant rotation back into the office sector, a move that defies the prevailing sentiment of the last two years.
The Contrarian Play: Office Volume Jumps 49%
In a quarter where institutional focus remained heavily on logistics, net-lease office investment quietly posted its strongest performance in recent memory. Volume in the sector rose 49% year-over-year to $3.8 billion.
This surge reshuffled the sector's market share, driving office to 24% of total net-lease investment, up from just 18% a year prior. This is not a signal of a sudden return-to-office mandate or a recovery in occupancy fundamentals. Rather, it is a credit story. In a net-lease structure, the real estate is secondary to the creditworthiness of the tenant. The sharp increase suggests that investors, hunting for yield in a stabilizing rate environment, identified mispriced risk in high-credit corporate HQs and mission-critical facilities.
Industrial Saturation and the Retail Steady State
Conversely, the industrial sector, long the darling of the net-lease world, showed signs of saturation. While it retained the majority share of investment at 55%, that figure is down significantly from 61% a year earlier. Industrial volume rose a negligible 1% year-over-year to $8.8 billion. The capital that was blindly chasing logistics yield in 2024 has become discerning, likely balking at compressed cap rates that no longer offer sufficient leverage against Treasuries.
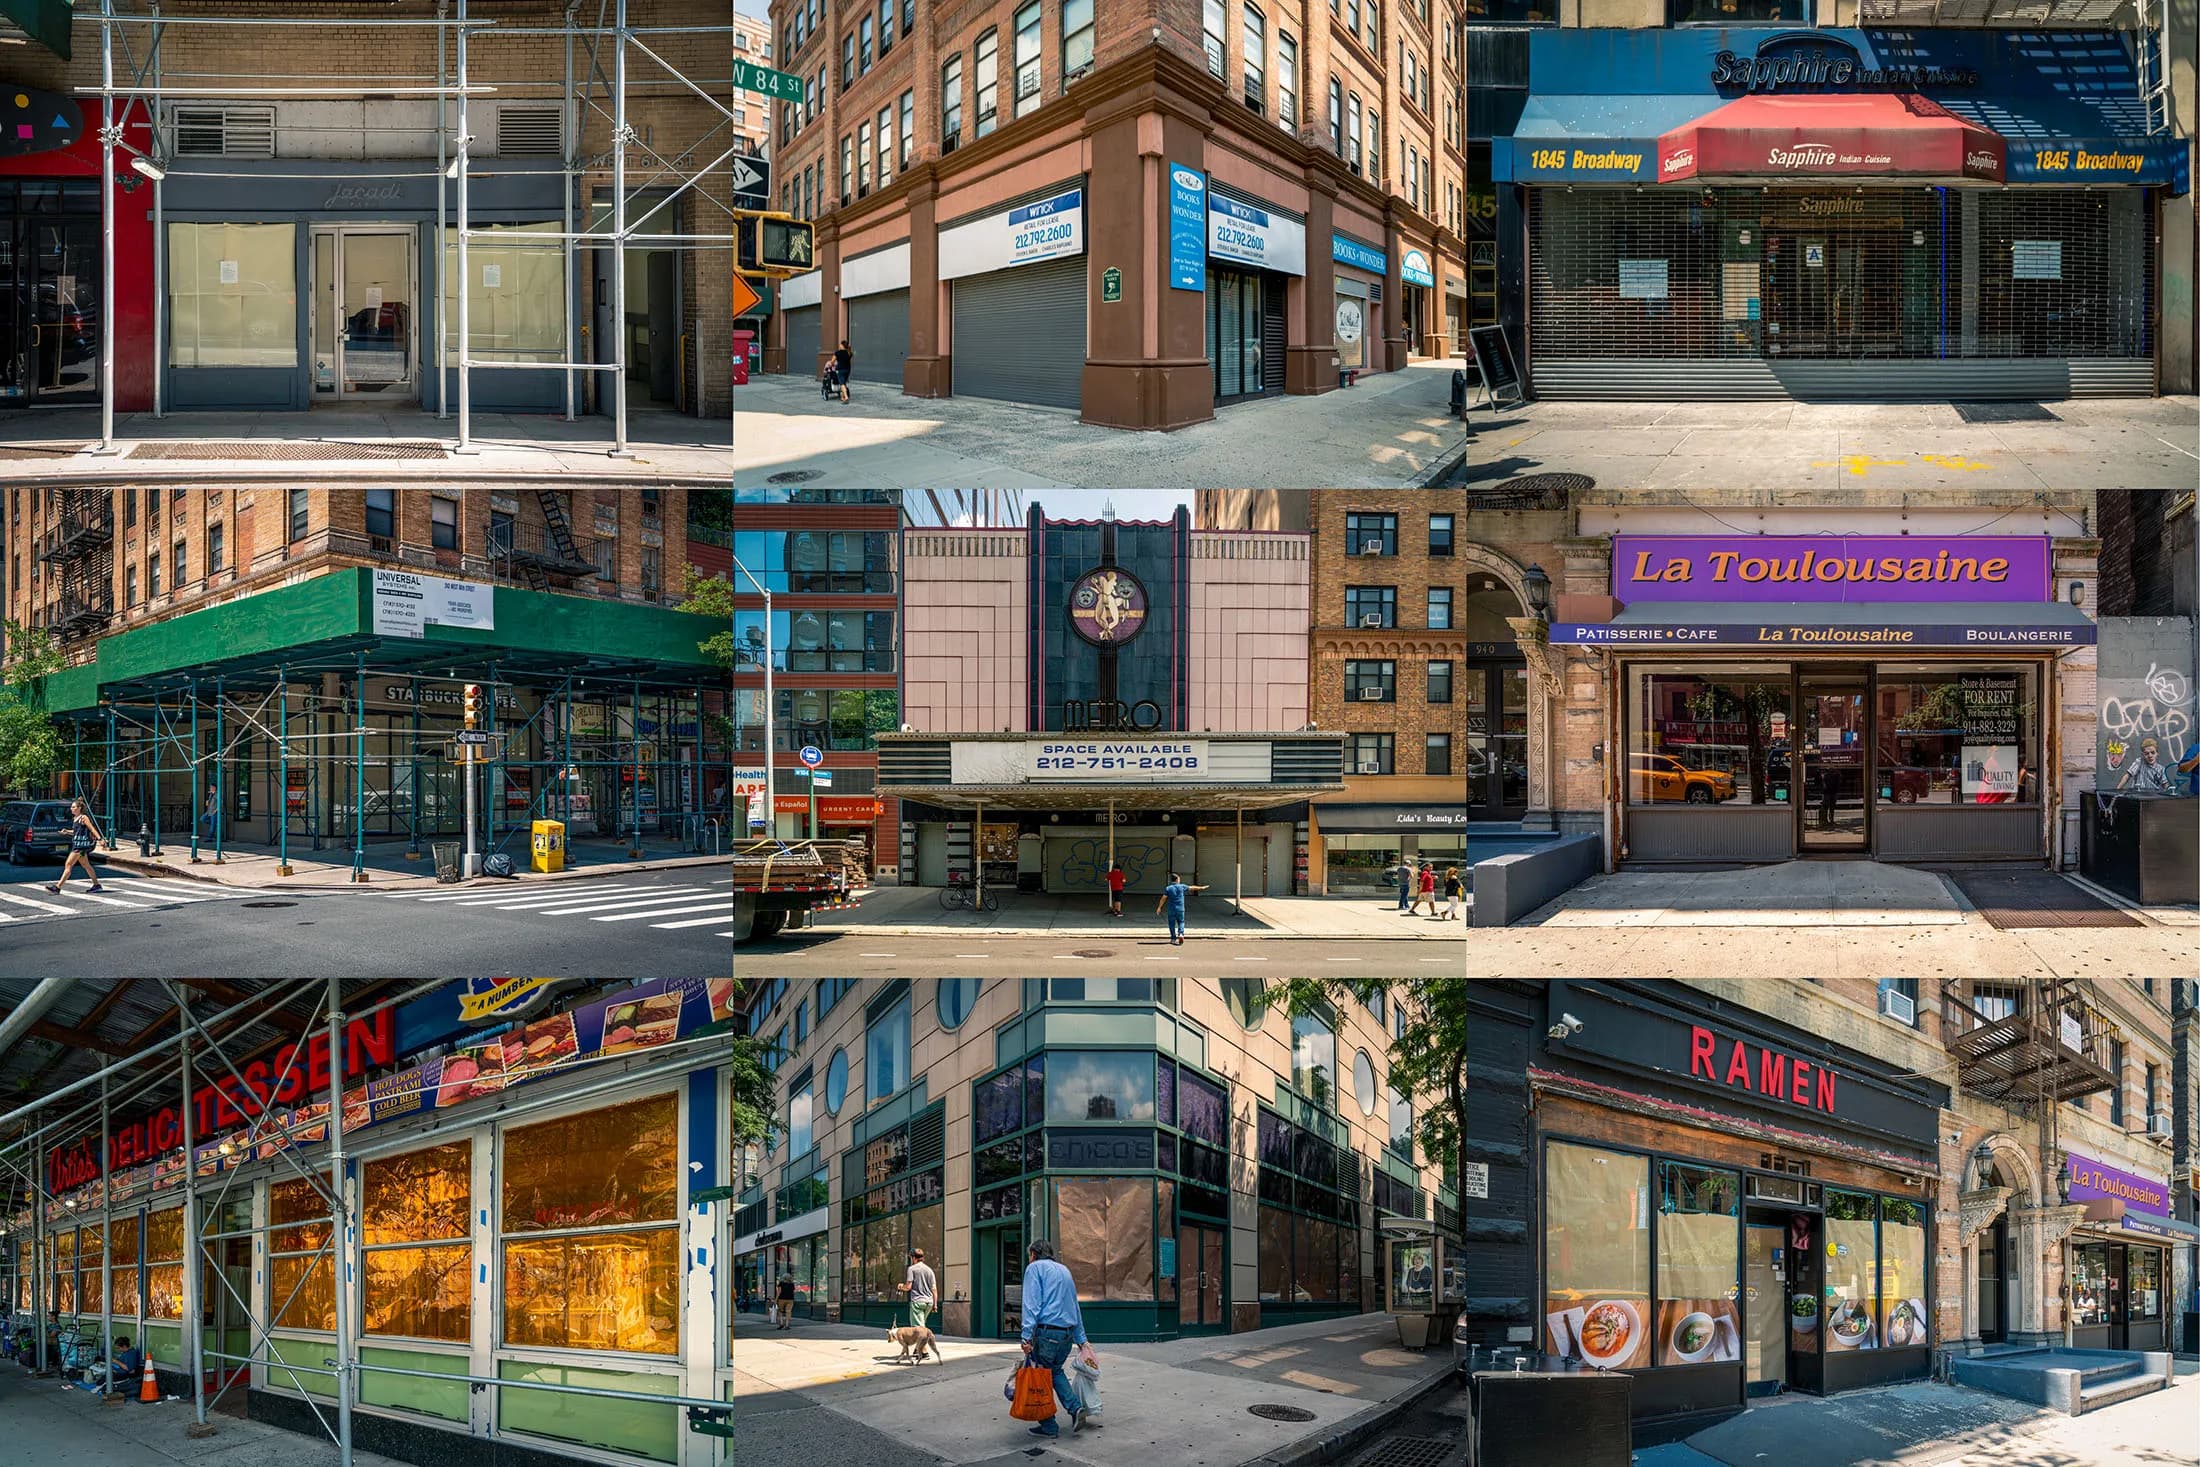
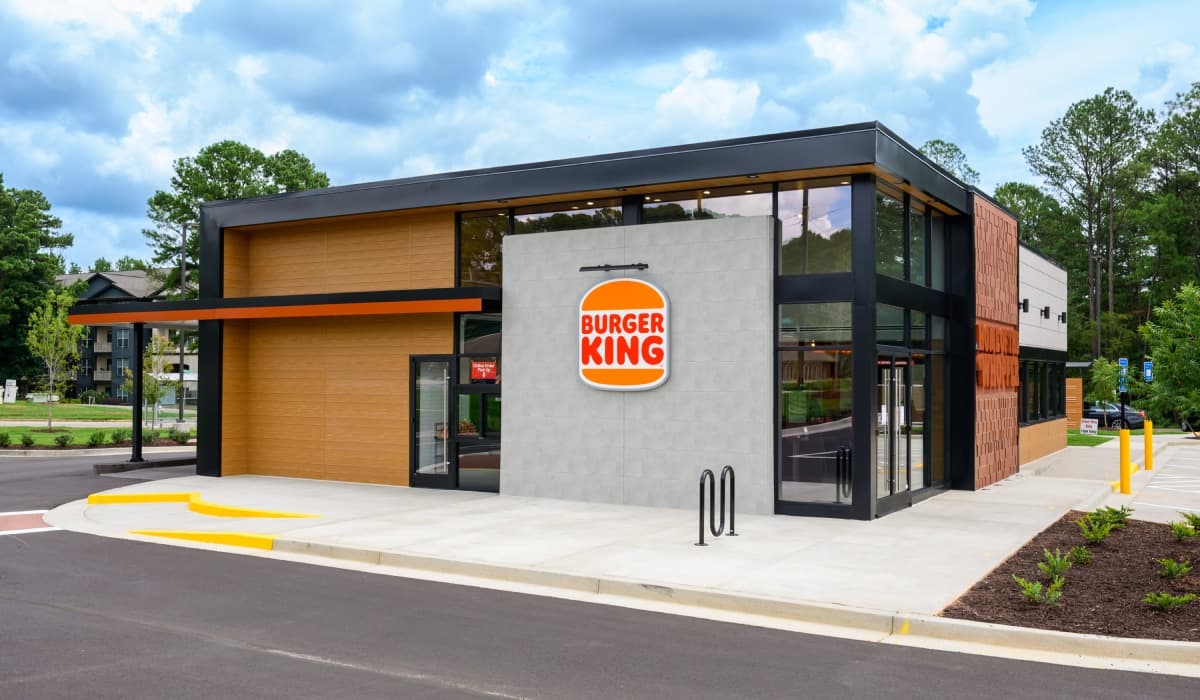
Retail investment remained the ballast of the sector, rising 15% to $3.3 billion and maintaining a consistent 21% market share. It remains the most efficient vehicle for private capital, but it lacked the institutional velocity seen in the office rebound.
The Financial Mechanics: It’s About the Spread
The engine behind this activity is the widening spread between cap rates and the risk-free rate.
Throughout Q4, the average 10-year Treasury yield fell by 25 basis points. Crucially, net-lease cap rates did not compress in lockstep; they remained largely stable. This created a widening arbitrage opportunity for buyers. The spread between the average net-lease cap rate and the 10-year Treasury expanded to 276 basis points, up from 248 basis points a year ago.
This 28-basis-point expansion in the spread is the key to understanding the Q4 volume. It provided the necessary cushion for leverage-sensitive buyers to re-enter the market. When the cost of debt falls but asset yields hold firm, transaction velocity inevitably accelerates.
As we move into 2026, the data indicates a market in transition. The "buy industrial at any price" trade appears over. The market is now rewarding yield discipline and credit analysis, driving capital into the most unlikely of places: the corporate office park.

Follow Us