Why Store-Level Transaction Data Is Reshaping Commercial Real Estate
Not long ago, shopping center owners made leasing decisions with gut instinct and foot traffic reports.
Not long ago, shopping center owners made leasing decisions with gut instinct and lagging foot traffic reports. They’d field tenant-reported sales numbers—sometimes quarterly, sometimes selectively shared—and cross their fingers that the performance on paper matched reality in the stores. In a pinch, they might lean on anecdotal observations: how busy a parking lot looked, how long a checkout line stretched on a Saturday. It was part science, part feel.
Today, that’s changed. Thanks to the widespread adoption of credit and debit cards, the commercial real estate industry has, for the first time, a credible and consistent way to measure actual retail sales at the store level. This shift—quiet but profound—is remaking how landlords, brokers, REITs, and retail investors operate.
At CenterCheck, we process anonymized credit and debit card data covering roughly 70% of all U.S. consumer card swipes. From this, we produce monthly sales figures for more than one million U.S. business locations, organized by brand, shopping center, category, and geography. This is not modeled data. It is actual transaction activity—aggregated, cleaned, and structured to reflect performance as it happened.
It’s possible because the U.S. is now a card-first economy. According to the Federal Reserve’s 2024 Diary of Consumer Payment Choice, more than 60% of monthly payments are now made using credit or debit cards. That number rises significantly in retail environments. Cash use has fallen to just 16%, and for purchases under $25—a longtime stronghold for coins and bills—cards are now the preferred tender. Even among Americans over the age of 55, who are statistically the most cash-reliant, card usage has eclipsed 60% in transaction volume. Younger consumers, especially those under 40, default to plastic or mobile wallets in almost every setting.
This evolution didn’t happen overnight. It accelerated with the pandemic, when contactless became the norm and e-commerce habits spread into brick-and-mortar environments. But the long-term trend has been clear for over a decade: cash is fading, and cards are becoming the backbone of consumer spending. And as card usage climbs, it brings with it a digital trail—one that, when properly organized and anonymized, reveals how money moves across physical retail.
For commercial real estate, this solves a decades-long blind spot. Historically, landlords relied on tenant self-reporting to track performance, or purchased highly generalized data from firms using sample-based projections. Foot traffic was useful, but not always correlated to sales. A bubble tea shop with 300 customers a day might produce less revenue than a quiet jewelry boutique with five. Meanwhile, investors evaluating properties had limited visibility into what specific tenants or categories were actually generating. The result was a landscape where many leasing, development, and acquisition decisions were made with partial or stale information.
With store-level sales data derived from card transactions, that gap closes. We can now measure not just what tenants say they’re doing, but what consumers are actually spending—month over month, location by location.
It also enables comparisons. Which brands are outperforming in grocery-anchored centers? Are fitness concepts drawing more spend per square foot than boutique apparel? What’s happening to fast casual sales in markets with new luxury residential density? These questions used to be answered with surveys or hearsay. Now they can be backed by measured spend data.
The implications are material. Consider a national QSR brand deciding whether to renew leases at 200 stores. With store-level sales performance in hand, they can identify not just which locations underperform their brand average—but which of those are lagging their direct competitors in the same center. That’s a sharper lens than internal data alone can provide.
Or take the case of a retail REIT holding a tier-two mall in a market with sluggish growth. The mall’s foot traffic is stable, but some of the anchors are weak and the surrounding narrative is bearish. If, however, the anonymized sales data shows that a cluster of specialty tenants in the center—say, skincare and wellness brands—are growing their ticket sizes and revenue month over month, that becomes a story worth telling. It might even justify a targeted redevelopment or re-tenanting strategy that boosts net operating income.
We’ve seen this play out directly. In 2024, one national developer evaluating a former department store box in a southeastern U.S. center used CenterCheck data to understand not just sales in that wing of the mall, but how adjacent tenants were faring across different dayparts. That informed a decision to subdivide the box into three junior anchors, one of which was a new-to-market home goods chain. Within three months of opening, that new anchor was outperforming the chain’s national store average by over 20%—a result the developer could measure in real time, with no need to wait for quarterly reports.
Retailers, too, are adapting. Chains with thousands of locations use card data to benchmark their own stores against market medians. If a major apparel brand sees that its San Diego locations are growing sales at half the rate of its competitors in the same zip codes, that’s a signal to reevaluate assortment, pricing, or staffing. If its stores in Nashville are outperforming by a wide margin, it might accelerate expansion in the region.
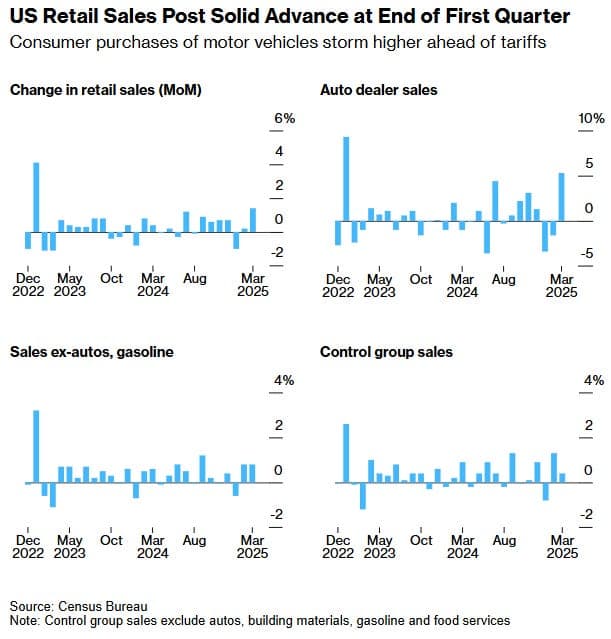
At a macro level, transaction data has become a crucial tool for understanding shifts in consumer behavior. In early 2025, when the Biden administration floated new tariffs on Chinese goods and the Trump campaign countered with proposed duties on Mexican imports, many economists expected a lull in discretionary spending. But card-based data revealed a different pattern: a pronounced jump in large-ticket purchases in March, especially in consumer electronics and home furnishings—driven by consumers buying ahead of anticipated price hikes. That spending surge was visible in card data weeks before official Census figures confirmed it. And in April, as those purchases tapered off, we could see the pullback just as clearly.
This responsiveness matters. In a retail climate where consumer sentiment can shift overnight, where promotions are planned weeks in advance, and where margins are under constant pressure from labor and supply costs, knowing how the market is behaving in near real time is more than a luxury. It’s a requirement.
That’s what makes card transaction data uniquely powerful. It doesn’t guess. It doesn’t model. It simply records where dollars are spent, how often, and for how much. And for the first time, commercial real estate has access to that data at scale, structured not for Wall Street, but for leasing teams, asset managers, and investment committees.
This isn’t about replacing instinct. It’s about informing it.
You can still walk the property. You can still see which storefronts draw crowds and which don’t. But when it comes to understanding what’s really working—who’s driving spend, how that spend is shifting, and where investment is justified—you need more than eyes. You need data.
And in today’s retail landscape, there’s no clearer signal than the swipe of a card.

Follow Us